
Screen Time Features on Smartphones: What They Measure and What They Miss

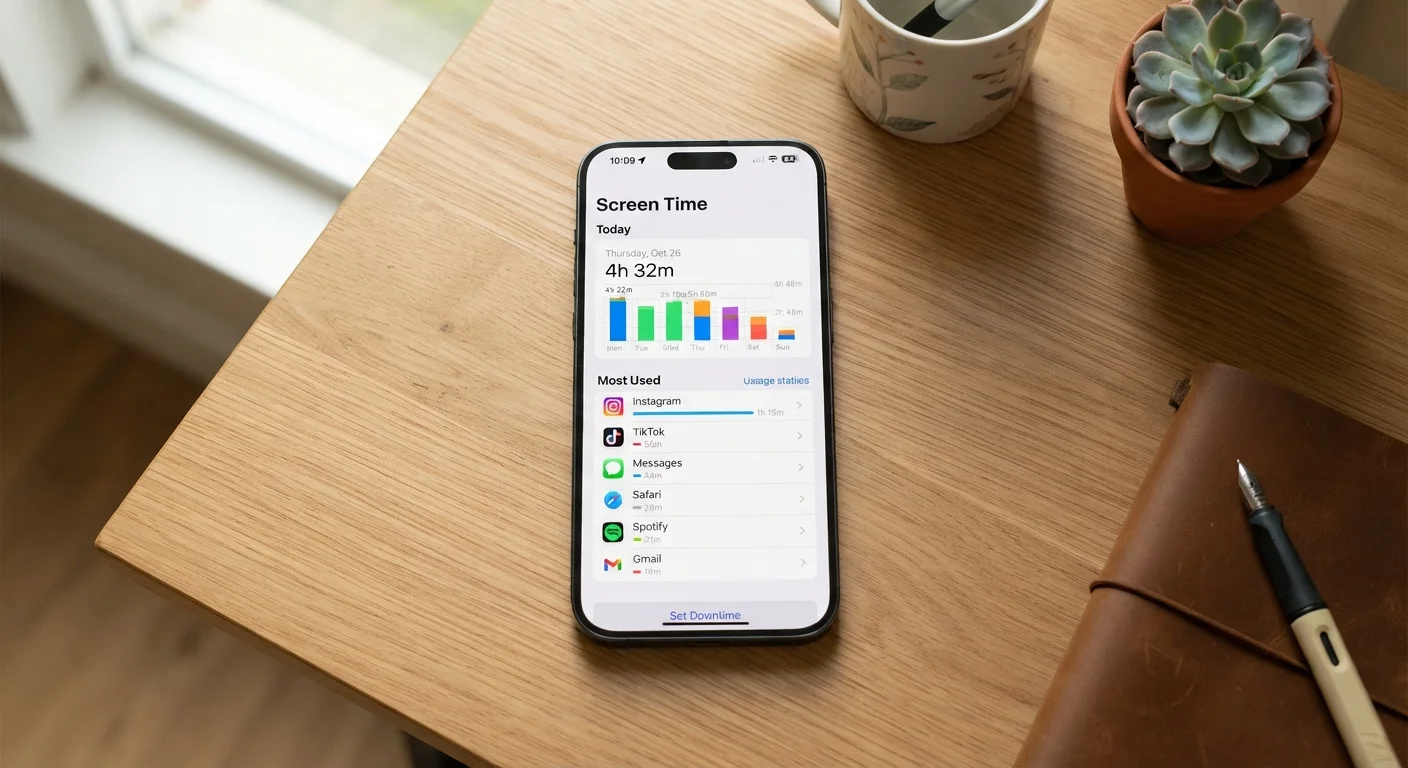
Photo: UnlockTopics.com | Unlocking Trending Content editorial
Key Takeaways
- Screen time tools track total minutes per app but cannot measure how focused or passive that time was.
- Both iOS Screen Time and Android Digital Wellbeing miss usage on other devices like tablets or computers.
- Downtime and app limits are easy to override, which reduces their effectiveness as hard guardrails.
- The data is most useful as a conversation starter about habits, not as a definitive wellness score.
- Parents can use these tools alongside dedicated parental controls for a more complete picture.
Raises awareness of habits you'd otherwise miss
Most people are surprised by their actual usage numbers the first time they check. Seeing a concrete figure — rather than guessing — is often enough to prompt a meaningful behavior shift.
Pickup counts reveal reflexive checking behavior
Tracking how many times you picked up the device surfaces habitual, low-intent interactions that total-time metrics alone would obscure.
Downtime scheduling adds a soft structural guardrail
Blocking most apps during set hours — like late evenings — creates friction around unconscious scrolling without requiring active willpower in the moment.
Free and built directly into the operating system
No additional app installation or subscription is required; the feature is available to all users running a reasonably current OS version.
Useful baseline for family oversight conversations
For parents, shared reports across linked accounts provide a visible starting point for discussing phone habits with children, even if the data is incomplete.
Measures quantity of time, not quality of engagement
The dashboard cannot distinguish between passive, mindless scrolling and focused, intentional use — both register as identical time in the same app category.
Completely blind to other devices and screens
Usage on tablets, laptops, smart TVs, or other phones is entirely absent from the data, meaning total screen exposure is routinely undercounted.
App limits are easy for users to override
On both major platforms, a single tap — or entering a passcode — is all it takes to dismiss a time limit, making the feature more of a nudge than a hard constraint for motivated users.
Category groupings can be misleading
A language-learning app and a slot-machine-style game may both be classified under the same 'Education' or 'Games' category depending on the platform's tagging, distorting per-category summaries.
Does not account for background audio or multitasking
Time spent with a podcast running in the background while you do something else may inflate audio-app usage figures, or conversely go uncounted if the screen is off.
No emotional or contextual dimension to the data
The tool cannot register whether a session was enjoyable, productive, or stressful — context that matters considerably when evaluating whether usage patterns are actually problematic.
What Screen Time Tools Actually Track
Both Apple's Screen Time (introduced in iOS 12) and Google's Digital Wellbeing (Android 9 and later) work by monitoring which apps are open and in the foreground on your device. Each session gets logged, timestamps are recorded, and the data is aggregated into daily and weekly summaries showing total minutes per app and per category — social media, entertainment, productivity, and so on.
Beyond raw minutes, these tools typically surface:
- Pickup counts — how many times you physically picked up the phone and woke the screen.
- Notification tallies — how many alerts arrived from each app.
- Daily averages — rolling seven-day usage trends so you can spot whether habits are shifting.
Some implementations also allow you to set app time limits, schedule downtime windows where most apps are blocked, and — relevant for families — apply those settings to linked accounts. For a deeper look at how the two platforms handle data collection more broadly, see our comparison of Android and iOS privacy approaches.
~4.5 hrs
Average daily US smartphone use
Research analytics firm data.ai (formerly App Annie) has consistently reported average daily smartphone screen time in the United States in the four-to-five-hour range across recent years.
80+
Average daily phone pickups reported by users
Internal data shared by Apple at the Screen Time feature launch indicated many users were picking up their devices more than 80 times per day, often for sessions of under a minute.
The Pros: Where These Features Deliver Real Value
Used with realistic expectations, screen time dashboards offer several concrete benefits.
Raises awareness of habits you'd otherwise miss
Most people are surprised by their actual usage numbers the first time they check. Seeing a concrete figure — rather than guessing — is often enough to prompt a meaningful behavior shift.
Pickup counts reveal reflexive checking behavior
Tracking how many times you picked up the device surfaces habitual, low-intent interactions that total-time metrics alone would obscure.
Downtime scheduling adds a soft structural guardrail
Blocking most apps during set hours — like late evenings — creates friction around unconscious scrolling without requiring active willpower in the moment.
Free and built directly into the operating system
No additional app installation or subscription is required; the feature is available to all users running a reasonably current OS version.
Useful baseline for family oversight conversations
For parents, shared reports across linked accounts provide a visible starting point for discussing phone habits with children, even if the data is incomplete.
The pickup count metric is particularly underrated. Most people dramatically underestimate how often they reach for their phone reflexively, and seeing a triple-digit daily pickup number can reframe the habit more effectively than total minutes alone.
The Cons: What the Numbers Don't Capture
The limitations are just as important to understand as the features themselves.
Measures quantity of time, not quality of engagement
The dashboard cannot distinguish between passive, mindless scrolling and focused, intentional use — both register as identical time in the same app category.
Completely blind to other devices and screens
Usage on tablets, laptops, smart TVs, or other phones is entirely absent from the data, meaning total screen exposure is routinely undercounted.
App limits are easy for users to override
On both major platforms, a single tap — or entering a passcode — is all it takes to dismiss a time limit, making the feature more of a nudge than a hard constraint for motivated users.
Category groupings can be misleading
A language-learning app and a slot-machine-style game may both be classified under the same 'Education' or 'Games' category depending on the platform's tagging, distorting per-category summaries.
Does not account for background audio or multitasking
Time spent with a podcast running in the background while you do something else may inflate audio-app usage figures, or conversely go uncounted if the screen is off.
No emotional or contextual dimension to the data
The tool cannot register whether a session was enjoyable, productive, or stressful — context that matters considerably when evaluating whether usage patterns are actually problematic.
Perhaps the most consequential gap is what researchers sometimes call the quality-versus-quantity problem. Thirty minutes video-calling a family member is not equivalent to thirty minutes of compulsive social media scrolling, yet both look identical in a usage report. The tool measures time in the foreground — nothing more.
There is also the cross-device blind spot. If you move from your phone to a tablet or laptop to continue the same activity, that continuation is invisible to your phone's screen time tracker. For households with multiple connected devices, total screen exposure can be significantly higher than the phone data suggests. This matters especially for parents — our article on what to think through before giving a child a smartphone covers why a single-device view is rarely the full picture.
Screen Time Data Stays On Your Device
Making Practical Use of the Data You Have
The most productive way to use screen time data is as a prompt for reflection rather than a verdict. A few approaches that make the numbers more actionable:
- Look at categories, not just totals. A high overall number dominated by navigation or podcasts tells a very different story than the same number driven entirely by short-form video.
- Track pickups alongside minutes. A moderate total with very high pickups often signals habitual checking behavior more than deep engagement.
- Use downtime strategically. Scheduling a wind-down window before sleep — where only selected apps remain available — tends to be more effective than per-app limits you can override with a tap.
- Cross-reference with how you actually felt. If you logged two hours of reading but felt refreshed, and one hour of social media left you drained, the subjective comparison tells you something the dashboard cannot.
Your phone also makes many low-visibility decisions about which apps and notifications surface most prominently — understanding those systems can help put usage data in context. Our piece on how smartphones decide what to show you first explains how those defaults work.
The content on this site is for informational purposes only and is not a substitute for professional advice. Always consult a qualified professional for guidance specific to your situation.